

US Dollar Price Action Talking Points:
- The US Dollar has moved down to test a big zone of support to kick of September trade.
- Correspondingly EUR/USD has put in its first test of the 1.2000 level in over two years.
- GBP/USD has been strong of recent, making a fast approach at the 1.3500 big figure before turning around earlier this morning.
- To learn more about price action, check out our DailyFX Education section, where it’s taught amongst a host of other candlestick patterns and formations.
US Dollar Tests Key Support to Kick of September
The first trading day of September and the US Dollar is already testing a huge zone of support. This is the same area of prices that we’ve been following for the past few weeks. Bears appeared to slow the approach when this zone came closer into play in late-July, and while sellers did still control the currency through August trade, as evidenced by the red candle on the Monthly chart, there seemed to be a diminishing effect as prices move closer and closer to the key support zone that just came into play.
This area is around the 92.00 handle on DXY: The price of 91.97 is the 38.2% retracement of the 2011-2017 major move, and the level of 91.93 is the 23.6% retracement of the 2017-2018 major move. Also of interest in this same zone of prices is a trendline projection that can be found by connecting 2011 and 2014 swing-lows, the projection of which falls directly in this same zone of prices that started to come into play this morning.
US Dollar Weekly Price Chart
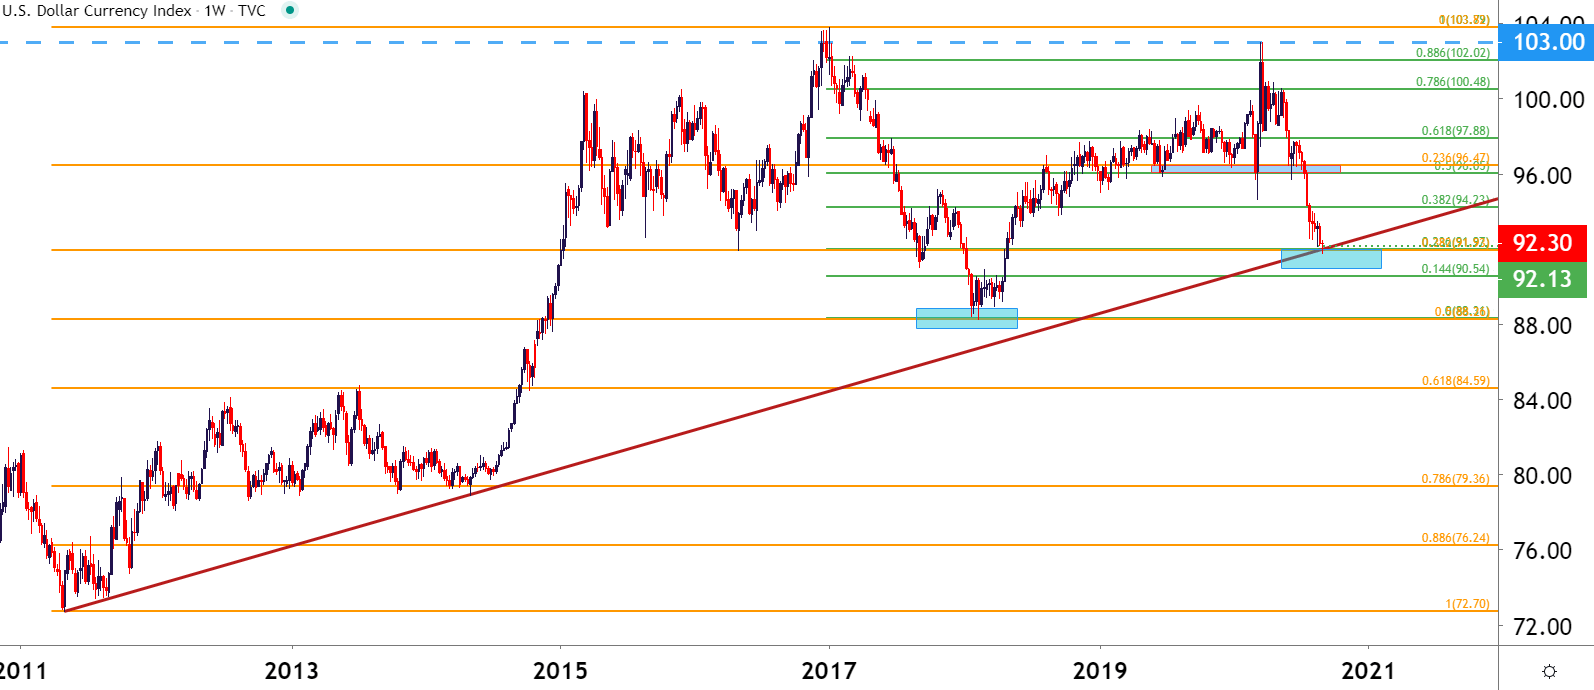
Chart prepared by James Stanley; USD, DXY on Tradingview
Bend or Break: USD is in the Spotlight
On the driver side of the equation, this week’s NFP report appears to be especially interesting, considering the penchant for that release to bring the volatility. That’s the biggest item out of the US on this week’s economic calendar and given the dynamics around employment in the US of late, likely this will receive considerable attention.

Recommended by James Stanley
Download our Q3 USD Forecast
On the US Dollar’s next direction, this is very similar to the matter that I had looked at earlier in August, investigating both sides of the Greenback for strategy potential. I had looked at the short side of the Euro for potential USD-strength strategies and conversely looked into Cable for strategies around USD-weakness. In that analyst pick, I had also outlined how a support test around 92.00 in the Greenback seemed inextricably linked to a resistance test in EUR/USD at the 1.2000 handle.
EUR/USD Tests 1.2000 as Euro Inflation Goes Negative
EUR/USD set a fresh two-year-high today, testing above the major psychological level that plots at the 1.2000 handle. But, oddly, the fundamental side of the equation seemed to suggest the opposite of strength when Euro-area inflation came in negative and pretty much disappointed across-the-board. The ECB may need to do even more QE, also not a positive for the Euro; but nonetheless the pair interacted with a major level earlier today.
This can keep the door open for reversal potential, particularly for those looking at strategies of strength around the USD. On the below Daily chart, notice the diverging RSI read as prices have made those higher-highs, capped off by today’s resistance inflection. There’s still a chance that today’s bar closes as a ‘pin bar’ and, if so, that supports the argument for EURUSD reversal potential.
To learn more about extended wicks on candlestick charts, check out our DailyFX Education Section
EUR/USD Daily Price Chart

Chart prepared by James Stanley; EUR/USD on Tradingview
GBP/USD Turns Before 1.3500 – Can Bulls Support the Move?
On the other side of the Greenback I had looked at bullish GBP/USD scenarios, basing off of a support hold around the 1.3000 big figure. That held through late-August trade with price action making a fast approach at the 1.3500 handle, but that fell flat earlier today.

Recommended by James Stanley
Building Confidence in Trading
But – this does keep the door open for items of potential bullish continuation, particularly should USD-weakness hold through the next week or so. For support on Cable, the 1.3350 area could function as a nearby zone or level to follow; and just below that is a confluent zone that runs from 1.3245-1.3275. Below that, as a possible ‘s3’ zone of support, is prior range resistance, running from around 1.3170-1.3200.
Starts in:
Live now:
Sep 08
( 17:09 GMT )

James Stanley’s Tuesday Webinar
Trading Price Action
GBP/USD Four-Hour Price Chart

Chart prepared by James Stanley; GBP/USD on Tradingview
— Written by James Stanley, Strategist for DailyFX.com
Contact and follow James on Twitter: @JStanleyFX
|
|
Leave a Reply
You must be logged in to post a comment.