

US DOLLAR OUTLOOK: USD PRICE ACTION HINGES ON STIMULUS DEAL DRIVEN VOLATILITY
Advertisement
Fiscal stimulus negotiations continue to largely drive the direction of the US Dollar. The DXY Index declined around half a percent during Monday’s trading session with FX traders still seeming optimistic that US politicians can agree on another coronavirus aid package before the upcoming election.
Over the weekend, House Speaker Nancy Pelosi placed a 48-hour deadline for the Trump Administration to reconcile their $1.8-trillion package proposal with the $2.2-trillion stimulus bill laid out by Democrats. Senate Leader Mitch McConnell is expected to call for a vote on a targeted stimulus deal that carries a much lower price tag at around $500-billion.

Recommended by Rich Dvorak
Trading Forex News: The Strategy
US DOLLAR INDEX PRICE CHART: DAILY TIME FRAME (17 JUL TO 19 OCT 2020)
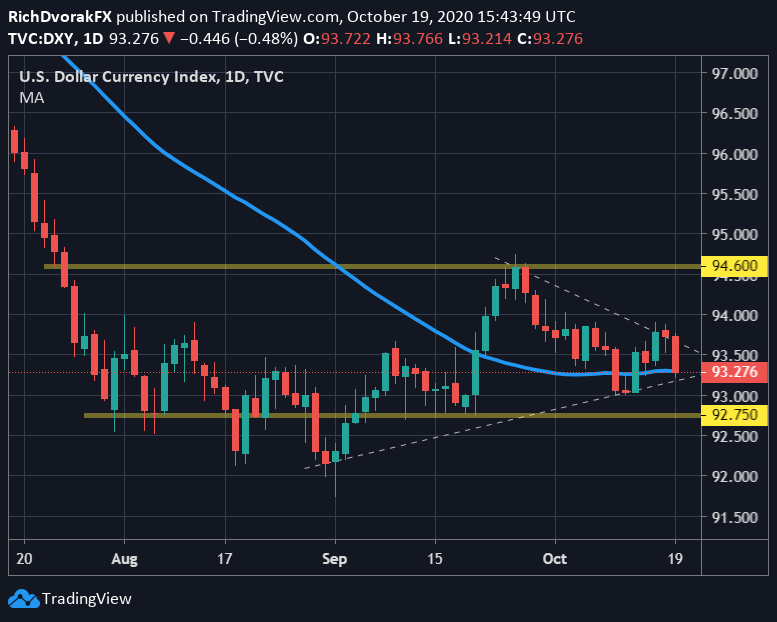
Chart by @RichDvorakFX created using TradingView
The prospect of more fiscal firepower to counter the coronavirus pandemic’s toll on the US economy is a primary driver of recent USD selling pressure. That said, uncertainty surrounding the likelihood that House Democrats and Senate Republicans can set aside their political differences to agree on another stimulus deal has contributed materially to US Dollar volatility. Discrepancies largely remain over the amount of fiscal funding to provide to state and local governments. Failure to reach a deal before the two-day deadline imposed by Speaker Pelosi opens up the door to potential for a big breakdown in stimulus negotiations, which would likely stand to send the US Dollar exploding higher and stocks swooning lower into the November 2020 election.

Recommended by Rich Dvorak
Forex for Beginners
Meanwhile, the broader DXY Index still gravitates around a critical level of technical confluence underpinned by its 50-day simple moving average. USD price action also looks coiled between two conflicting trendlines: a short-term bearish trend identified by the lower highs recorded on 25 September and 15 October juxtaposed with a medium-term bullish trend developing from higher lows printed on 31 August and 12 October. A break below the ascending trendline could tee-up a quick move toward technical support highlighted by the 92.75-price level whereas a break above the descending trendline might motivate US Dollar bulls to target the 94.00-handle and September swing highs.
USD PRICE OUTLOOK: US DOLLAR IMPLIED VOLATILITY TRADING RANGES (1-WEEK)
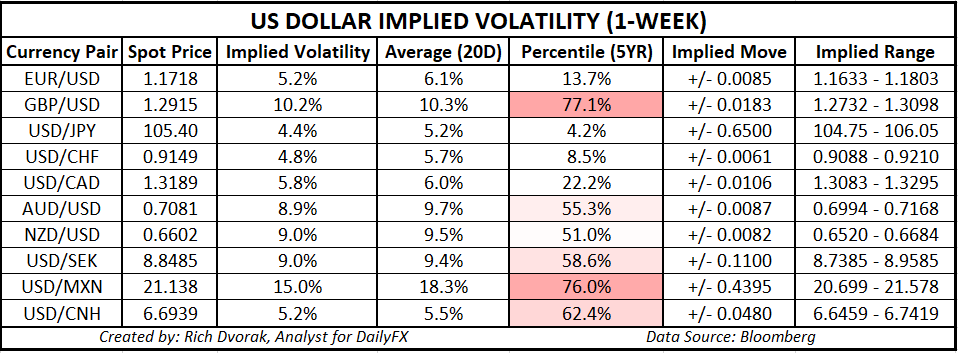
Key FX counterparts to the US Dollar – such as the EUR and GBP – have also contributed to recent Greenback turbulence. EUR/USD and GBP/USD comprise 57.6% and 11.9% of the DXY Index respectively and thus tend to weigh notably on the broader US Dollar. As new COVID-19 cases climb and restrictions on business activity are reimplemented across the Eurozone and UK, mounting coronavirus concerns might exacerbate potential US Dollar strength given its status as a top safe-haven currency.

Recommended by Rich Dvorak
Get Your Free USD Forecast
Not to mention, the Pound-Dollar remains exposed to ongoing Brexit drama as well. GBP/USD is estimated to be the most active major currency pair this week according to one-week implied volatility readings clocked as of Friday’s close. Options-implied trading ranges are calculated using 1-standard deviation (i.e. 68% statistical probability price action is contained within the implied trading range over the specified time frame).
— Written by Rich Dvorak, Analyst for DailyFX.com
Connect with @RichDvorakFX on Twitter for real-time market insight
|
|
Leave a Reply
You must be logged in to post a comment.