

[embedded content]
RAND ANALYSIS
- Local outlook remains contentious despite riot suppression.
- South African Reserve Bank (SARB) remains accommodative.
- USD/ZAR primed for bearish downturn.
Advertisement
ZAR FUNDAMENTAL BACKDROP
The rand has been pulling back some of its lost gains against the U.S. dollar in line with dollar weakness across the majority of Emerging Market (EM) currencies. The ZAR appreciation comes as positive news in the midst of local turmoil unrest which has since subsided. Unfortunately for South Africans, the political consequence of the civil unrest persists as the African National Congress (ANC) is divided as to how to proceed. Every decision from here on will prove crucial to the future of the economy as well as investor confidence both local and abroad.
GET YOUR Q3 RAND FORECAST HERE!
Local export commodities (gold, platinum and iron ore) have also been weaker this week which further substantiates rand resilience.
SARB HOLDS RATES AT 3.5%
The SARB did not change interest rates while the Reserve Banks approach outlined by Finance Minister Lesetja Kganyago was almost a mirror image of the previous rate announcement. The decision was unanimous which may have been prompted by last weeks protest action throughout the KwaZulu-Natal and Gauteng provinces respectively. A few key points mentioned:
- Higher forecasted COVID-19 cases expected.
- Reduction in close contact sectors such as tourism.
- Recent unrest likely to hinder GDP growth for the remainder of 2021.
- Short-term headline inflation revised to the upside.
- Interest rate path going forward entails a 25bps hike in Q4 of 2021 with this quarterly trend continuing until the end of 2022.
- SARB remains dependent on data and event risk which can alter the aforementioned rate path.
ATTENTION ON U.S. MANUFACTURING PMI AS THE WEEK CLOSES
Volatility on USD crosses are to be anticipated pre-PMI announcement tomorrow (see calendar below). Any unexpected release figure will likely spark significant price fluctuation therefore ensuring sound risk management technique is key.
USD/ZAR ECONOMIC CALENDAR

Source: DailyFX economic calendar
TECHNICAL ANALYSIS
USD/ZAR WEEKLY CHART
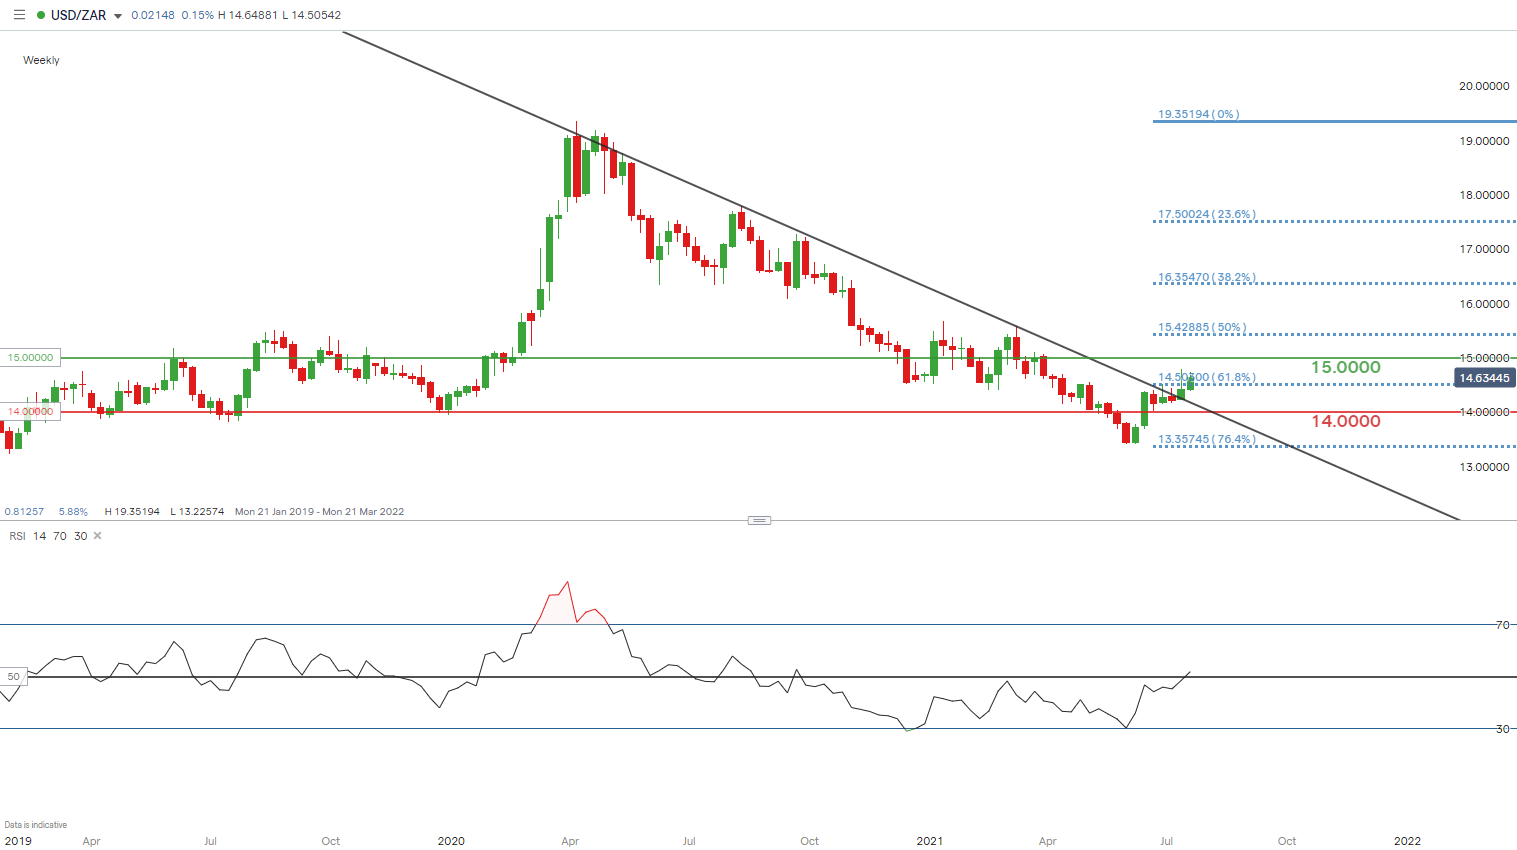
Chart prepared by Warren Venketas, IG
The long-term weekly USD/ZAR chart above shows the recent break above trendline resistance (black) as predicted in my USD/ZAR Q3 forecast last month. Since then, the 14.5000 psychological zone has provided a central point for the recent consolidatory price action. However, this bullish uptick could be slowing which could see moves back toward or below the 14.5000 handle.
USD/ZAR 4-HOUR CHART
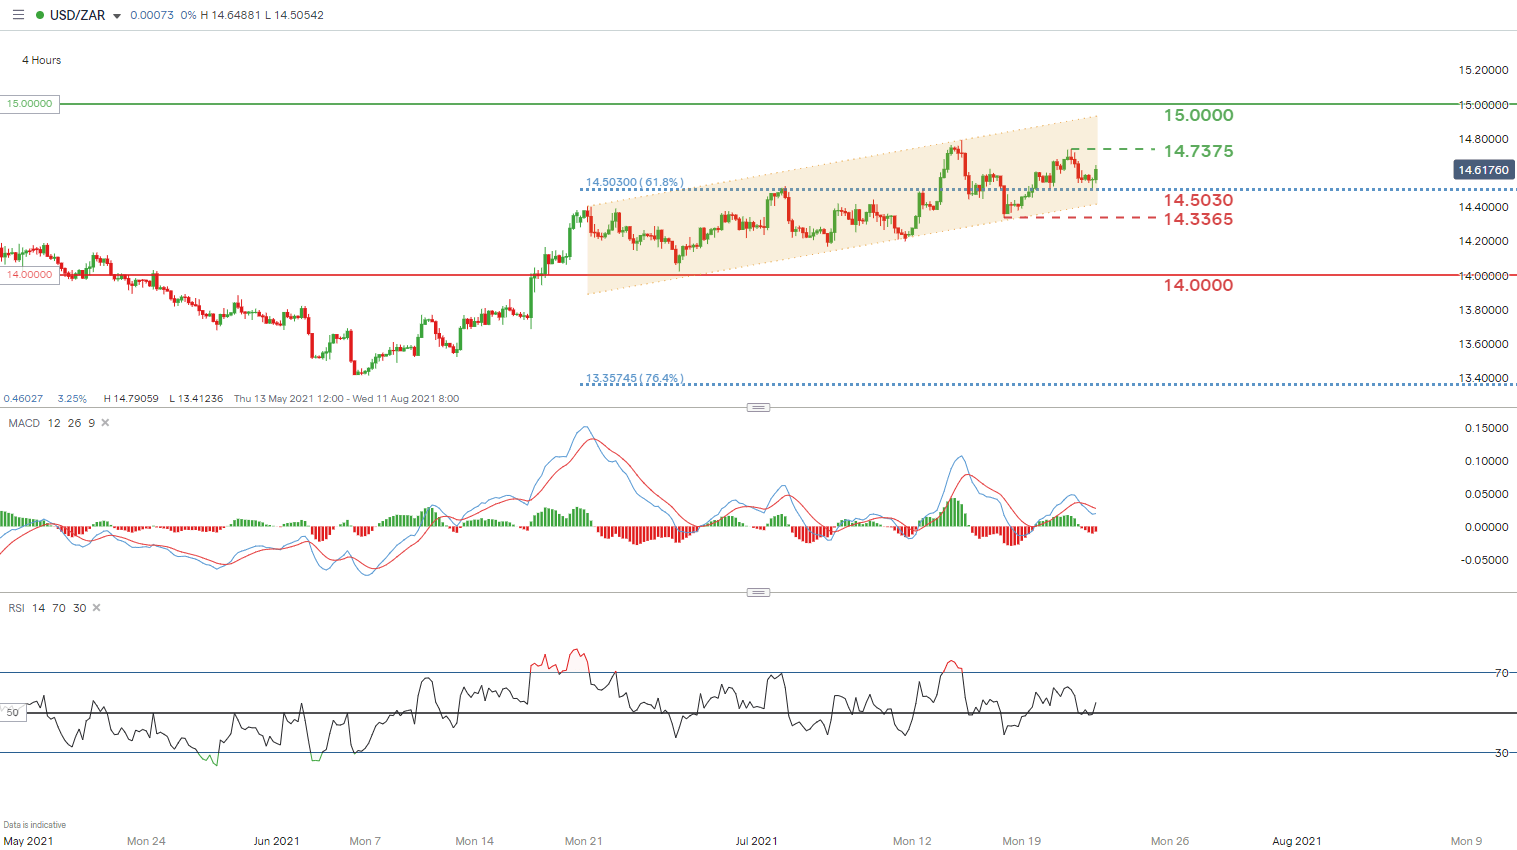
Chart prepared by Warren Venketas, IG
The 4-hour chart paints a bearish picture as a potential for the completion of the current bear flag formation looms. A bear flag is a bearish continuation pattern that is typically preceded by a strong downtrend. A break below flag/channel support (yellow) could see downside target levels come into play as outlined above – 14.5030, 14.3365.
Similarly, a push above flag/channel resistance (yellow) will invalidate the bear flag and could see further upside price movement towards 14.7375 and 15.0000 respectively.
— Written by Warren Venketas for DailyFX.com
Contact and follow Warren on Twitter: @WVenketas
|
|
Leave a Reply
You must be logged in to post a comment.