

USD/JPY Price and Chart Analysis
- The Fed is gearing up to stamp out soaring US price pressures.
- The USD/JPY 125.00 ‘line in the sand’ is likely to be re-tested.
The latest FOMC minutes, released yesterday, highlight the Fed’s determination to get rampant inflation under control by squeezing monetary policy. The US central bank is now looking more in sync with current market expectations of another 225 bps+ of rate increases this year, while the Fed also gave an outline of how they will reduce their bloated $9 trillion balance sheet.
Fed Minutes Lay Out Hawkish Balance Sheet Reduction Plan, Nasdaq 100 Holds Losses
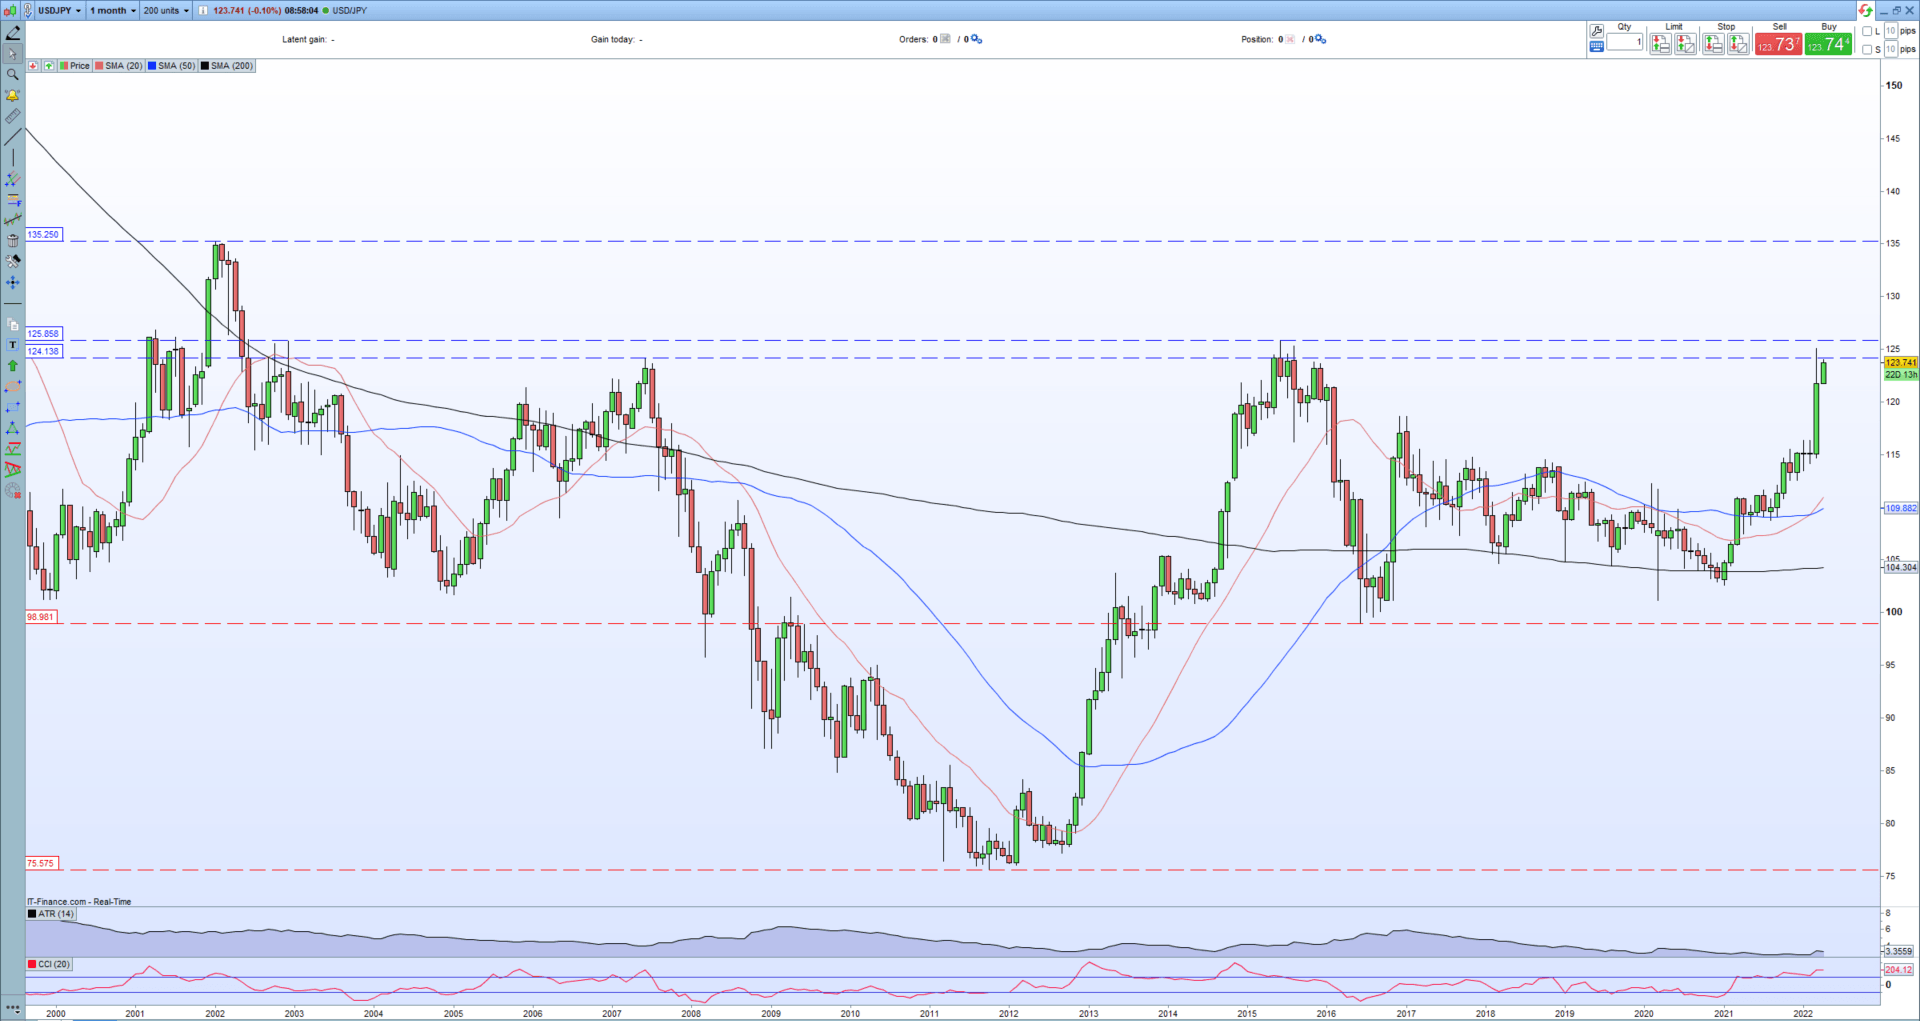
USD/JPY spiked above 125.00 on March 26 before falling back below on the news that the Bank of Japan was trying to temper rising 10-year JGB yields by buying unlimited amounts to keep the yield below 0.25%. This quantitative easing is in direct contrast to the Federal Reserve which is embarking on quantitative tightening to help force US Treasury yields higher. The USD/JPY 125.00 level has been seen for years as a line in the sand for the BoJ before they become more vocal about their unease about the level of the Yen. The BoJ will not be unhappy seeing the Yen at its current level as it tries to drive up domestic inflation, and it may be that the Japanese central bank is willing to let USD/JPY trade higher.
The monthly USD/JPY chart shows the pair touching a multi-year zone of resistance between 124.14 and 125.86, an area that has not only held firm in recent years but has also produced a sharp turn lower. If the BoJ is comfortable with the Yen at current levels, it may well allow a re-test of this resistance and a break higher before any verbal intervention. The 135.25 January 2002 high may be a step too far, but a push to 130.00 is not out of the question.
USD/JPY Monthly Price Chart – April 7, 2022
Retail trader data show 25.10% of traders are net-long with the ratio of traders short to long at 2.98 to 1. The number of traders net-long is 14.16% lower than yesterday and 2.35% higher from last week, while the number of traders net-short is 6.72% higher than yesterday and 1.64% higher from last week.
We typically take a contrarian view to crowd sentiment, and the fact traders are net-short suggests USD/JPY prices may continue to rise. Positioning is more net-short than yesterday but less net-short from last week. The combination of current sentiment and recent changes gives us a further mixed USD/JPY trading bias.
What is your view on the Japanese Yen – bullish or bearish?? You can let us know via the form at the end of this piece or you can contact the author via Twitter @nickcawley1.
|
|
Leave a Reply
You must be logged in to post a comment.