

[embedded content]
Nasdaq 100 Price Forecast:
Why Did the Nasdaq 100 Fall Today? What it Means for Tech Earnings
The Nasdaq 100 suffered an abrupt decline Wednesday as risk appetite reeled and global equity markets pulled back on news that both France and Germany are locking down to stem the spread of coronavirus. The French and German economies make up a significant portion of the Euro area economy, leaving investors concerned with the growth outlook for the region. Further still, election uncertainty and an ongoing earnings season have created market volatility of their own, creating an incredibly volatile environment for stock traders.
Advertisement
The volatility may be poised to continue as all three themes develop further with upcoming earnings from Apple, Amazon, Facebook and Google due Thursday afternoon. The corporate behemoths represent more than 35% of the entire Nasdaq 100 and have been responsible for much of the index’s gains this year. Together, the group is also vital to the sentiment surrounding technology stocks.
After an encouraging report from Microsoft on Tuesday it seemed as though the quarterly findings might enjoy a sturdy backdrop, but after Wednesday’s price action, the reports will be released into a warzone. Since sentiment has already been severely damaged, these reports run the risk of adding fuel to the fire if results fail to meet expectations. Already this week German software company SAP displayed the ramifications of issuing poor guidance when it cratered by more than 20% in a single session.
Considering the disastrous price reaction to SAP earnings and the tepid reaction to a solid report from Microsoft, it seems risks are skewed to the downside. Bad results are being met with steep declines and encouraging performances are met with relative indifference, surely a symptom of a damaged sentiment. Suffice it to say, the Nasdaq 100 might be in serious trouble if any of the reports from Apple, Amazon, Google and Facebook are less than perfect.
Nasdaq 100 Price Chart: 1 – Hour Time Frame (September 2020 – October 2020)
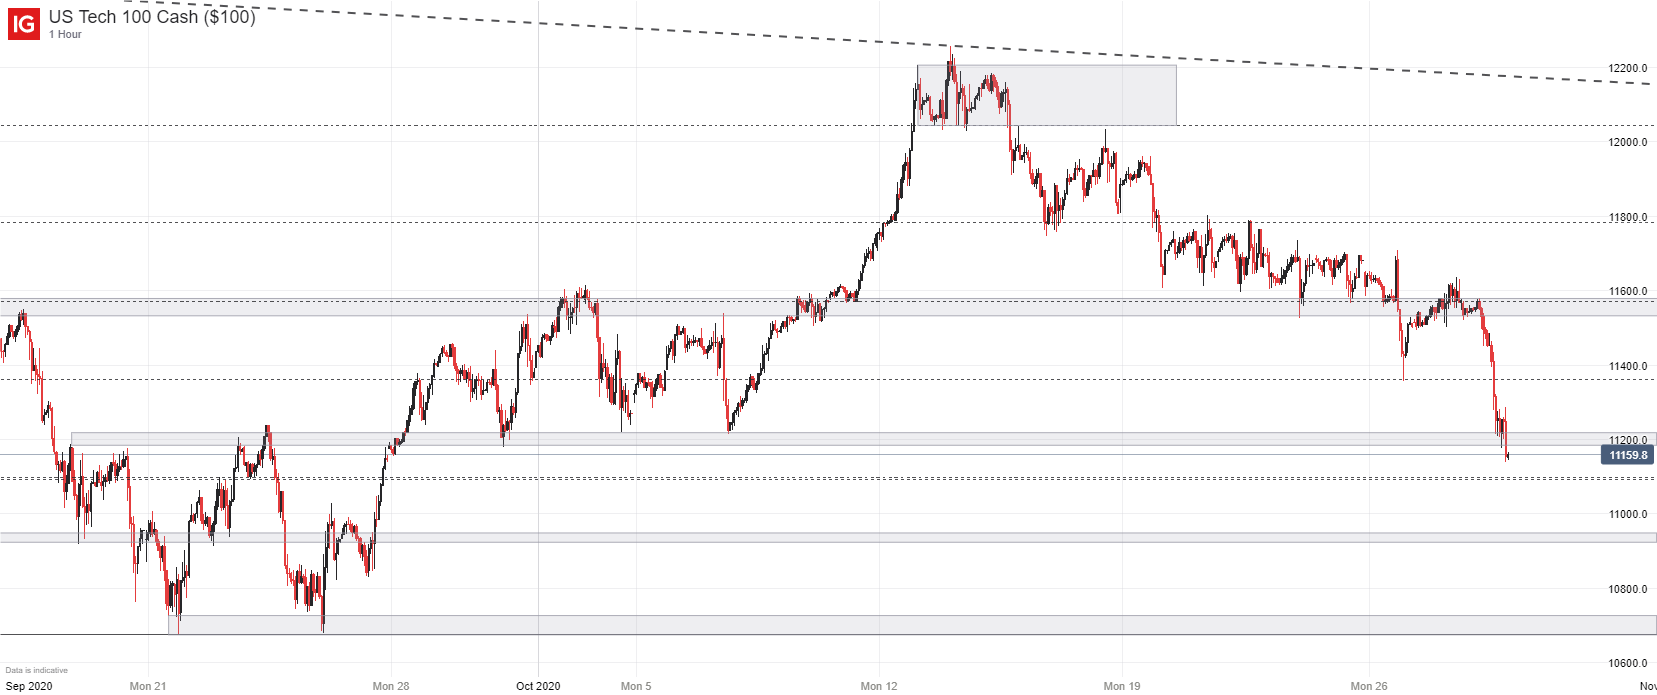
To that end, Wednesday’s price action saw the Nasdaq take out previously identified support around 11,360 and even 11,200. Suffering a close beneath the latter, the index appears vulnerable to further declines from a technical perspective and the next area of potential support at 11,090 does not necessarily look positioned to stall a decline of this magnitude on its own. Thus, the more important levels might reside even lower, around the 10,950 and 10,675 respectively.

Recommended by Peter Hanks
Get Your Free Equities Forecast
Coinciding with the September low, 10,675 is the de facto “line in the sand” at this point. A breach of this area would establish a lower-low compared to the September trough and effectively establish evidence of a broader downtrend for the Nasdaq.
Nasdaq 100 Price Chart: 4 – Hour Time Frame (August 2020 – October 2020)
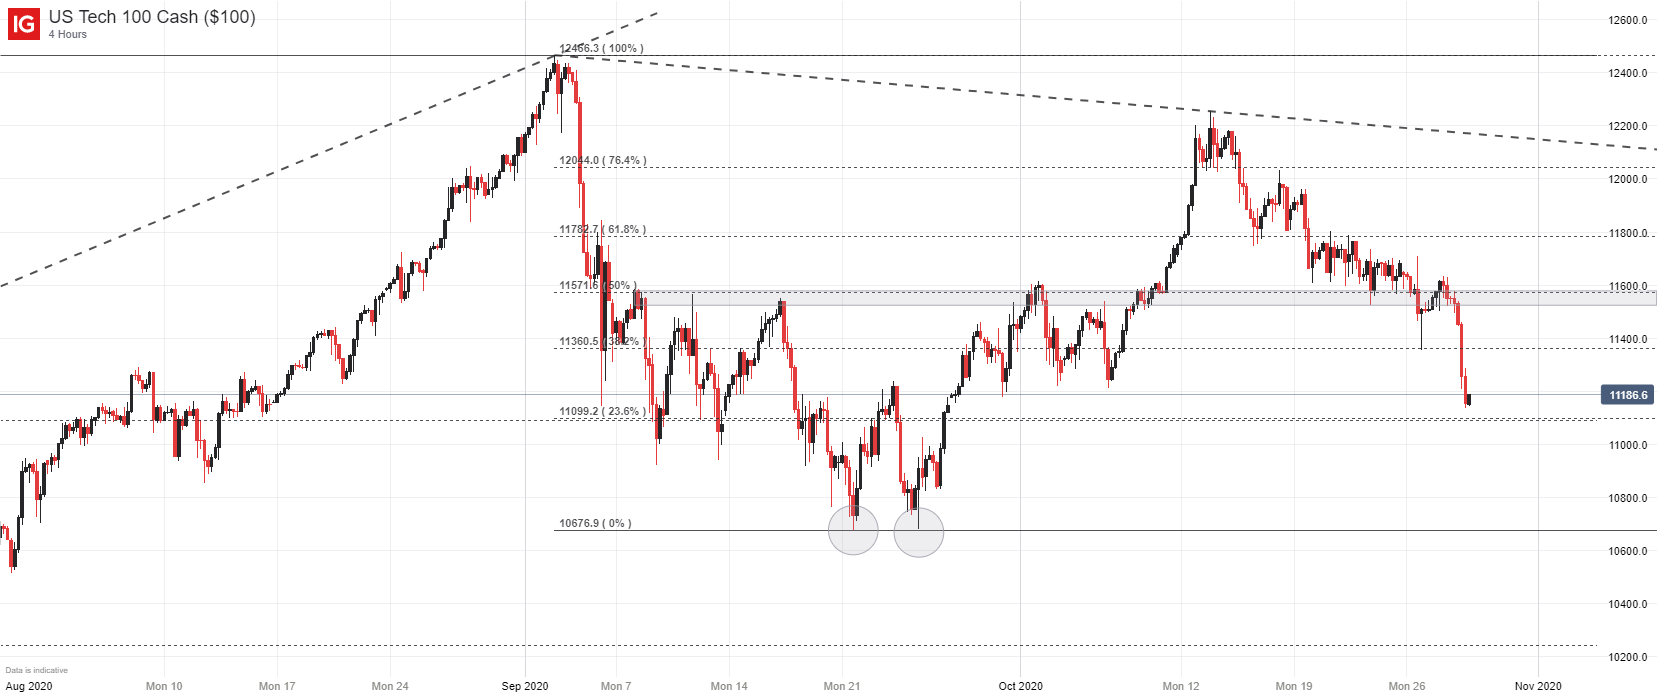
As it stands, it could be argued September’s decline was a consolidation period in a longer-term uptrend, but a drive below the level could suggest prior declines were the building blocks of a larger retracement. Therefore, a break beneath 10,675 would really undermine the technical outlook of the Nasdaq 100 in my view. In the meantime, follow @PeterHanksFX on Twitter for updates and analysis.
–Written by Peter Hanks, Strategist for DailyFX.com
Contact and follow Peter on Twitter @PeterHanksFX
|
|
Leave a Reply
You must be logged in to post a comment.