

SILVER PRICE ANALYSIS
- Fading silver volatility not yet enough to hold back bulls
- Silver continues strong bull run, but may soon be poised for technical reversal
- The COT report and IG Client Sentiment Index point towards possible shifts in momentum
SILVER HOLDING ONTO GAINS DESPITE ADVERSE TECHNICAL AND FUNDAMENTAL DRIVERS
Beginning in mid-March 2020, silver has continued to track its safe haven counterpart (Gold) to fresh highs. US Dollar weakness has provided a boost for precious metals which may continue if demand for the greenback remains depressed.
Volatility is a key factor when analyzing precious metals as it generally follows a positive linear relationship (safe haven appeal), which is why rising silver prices against decreasing volatility does not follow typical correlation guidelines.
The chart below shows silver volatility as measured by the CBOE Silver ETF Volatility Index (VXSLV). This chart roughly mirrors that of the VIX (CBOE Volatility Index) and GVZ (CBOE Gold Volatility Index). Although silver fluctuates between a base and precious metal, recent economic factors have firmly rooted it in precious metal status for now.
CBOE SILVER ETF VOLATILITY INDEX (VXSLV): 3-MONTH CHART
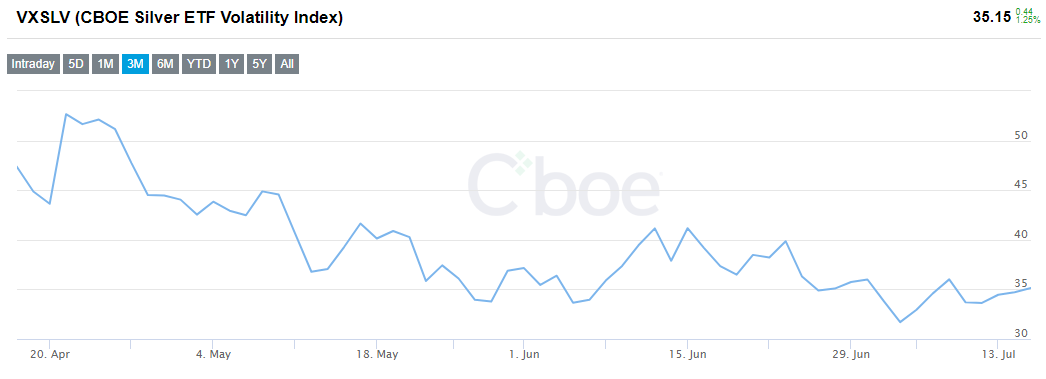
Source: CBOE
SILVER PRICE TECHNICAL ANALYSIS: DAILY CHART
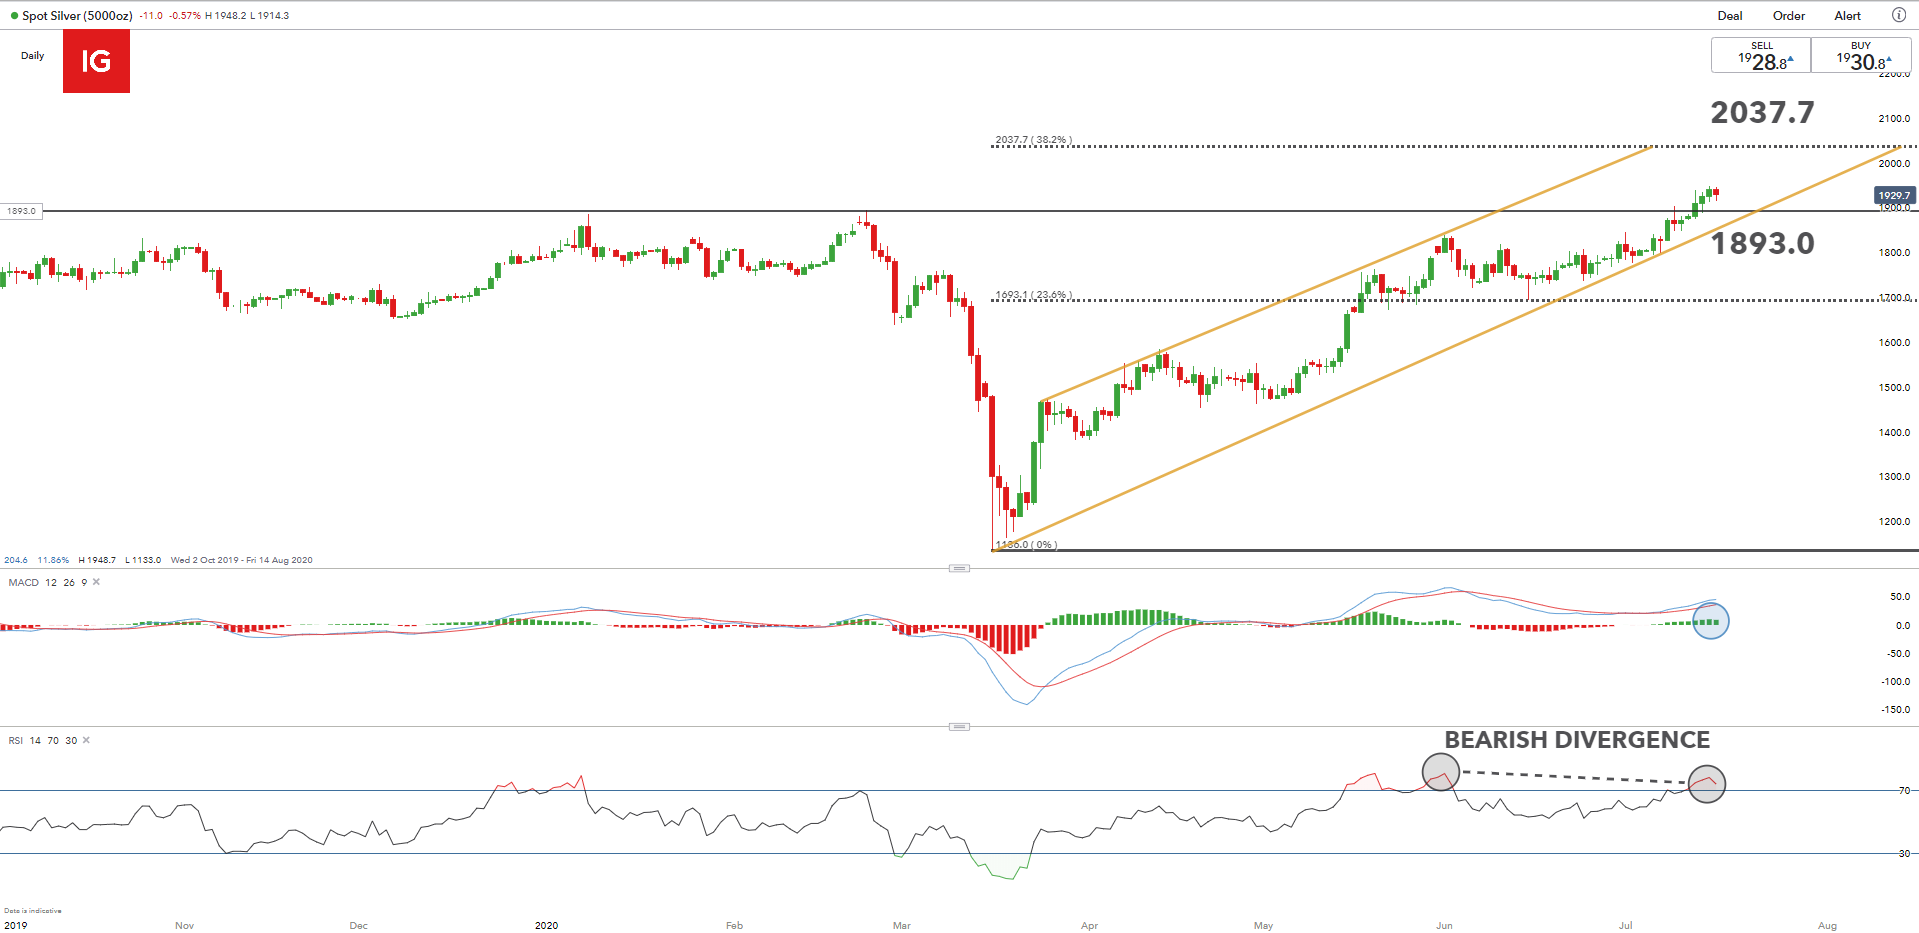
Chart prepared by Warren Venketas, IG
From a technical standpoint, the medium-term trend is decisively bullish as denoted by higher highs and higher lows wading through the bullish price channel (yellow). Price has just broken through the resistance turned support zone around 1893.0, and above the 1900.0 psychological level. If bulls continue to push the price rally, the next area of resistance may be seen at the 2037.7 (38.2%) Fibonacci level (black) – Fibonacci levels taken from April 2011 high to March 2020 low.
Bears have a lot to look forward to with increasing technical and fundamental drivers appearing. The daily chart above includes the MACD and RSI indicators, which both suggest a fading bullish momentum. The RSI is declining (black), while silver prices continue to rise which is technically indicative of a bearish reversal.
The MACD histogram (blue) shows a series of rising ‘green’ bars with the most recent being slightly smaller. If this bar closes smaller than the preceding bar, this is seen as a possible bearish signal. Often MACD histograms are overlooked by the more popular MACD signal lines, but histograms can provide timelier signals as it is based on a faster setting.
COT REPORT: SILVER
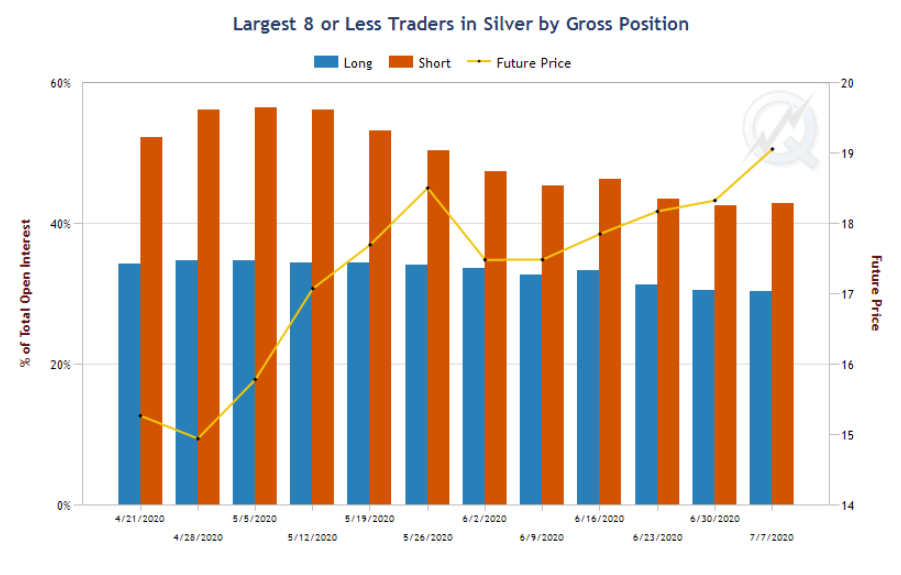
Source: CME Group, Commitment of Traders (COT)
The COT report outlines the market open interest for various financial instruments. The Silver report shown above gives traders an indication of net positioning by the colloquially known ‘smart money’. We can see overall long exposure for the 8 largest traders by gross position has been lessening (blue bars), while short position exposure is on the rise (last orange bar). Traders are positioning themselves on the short side which may reveal an impending downside move in Silver price action.
The Predictive Power of the COT Report
SILVER STRATEGY MOVING FORWARD
Taking into account the inverse relationship convention between the US Dollar and Silver, traders will need to monitor US Dollar price action. The chart below shows US Dollar Index (DXY) trading at key support levels (blue). With the notion of ‘safe haven’ being somewhat excluded (low volatility), the US Dollar can be seen as the predominant enduring factor driving Silver prices.
DOLLAR INDEX PRICE TECHNICAL ANALYSIS: DAILY CHART
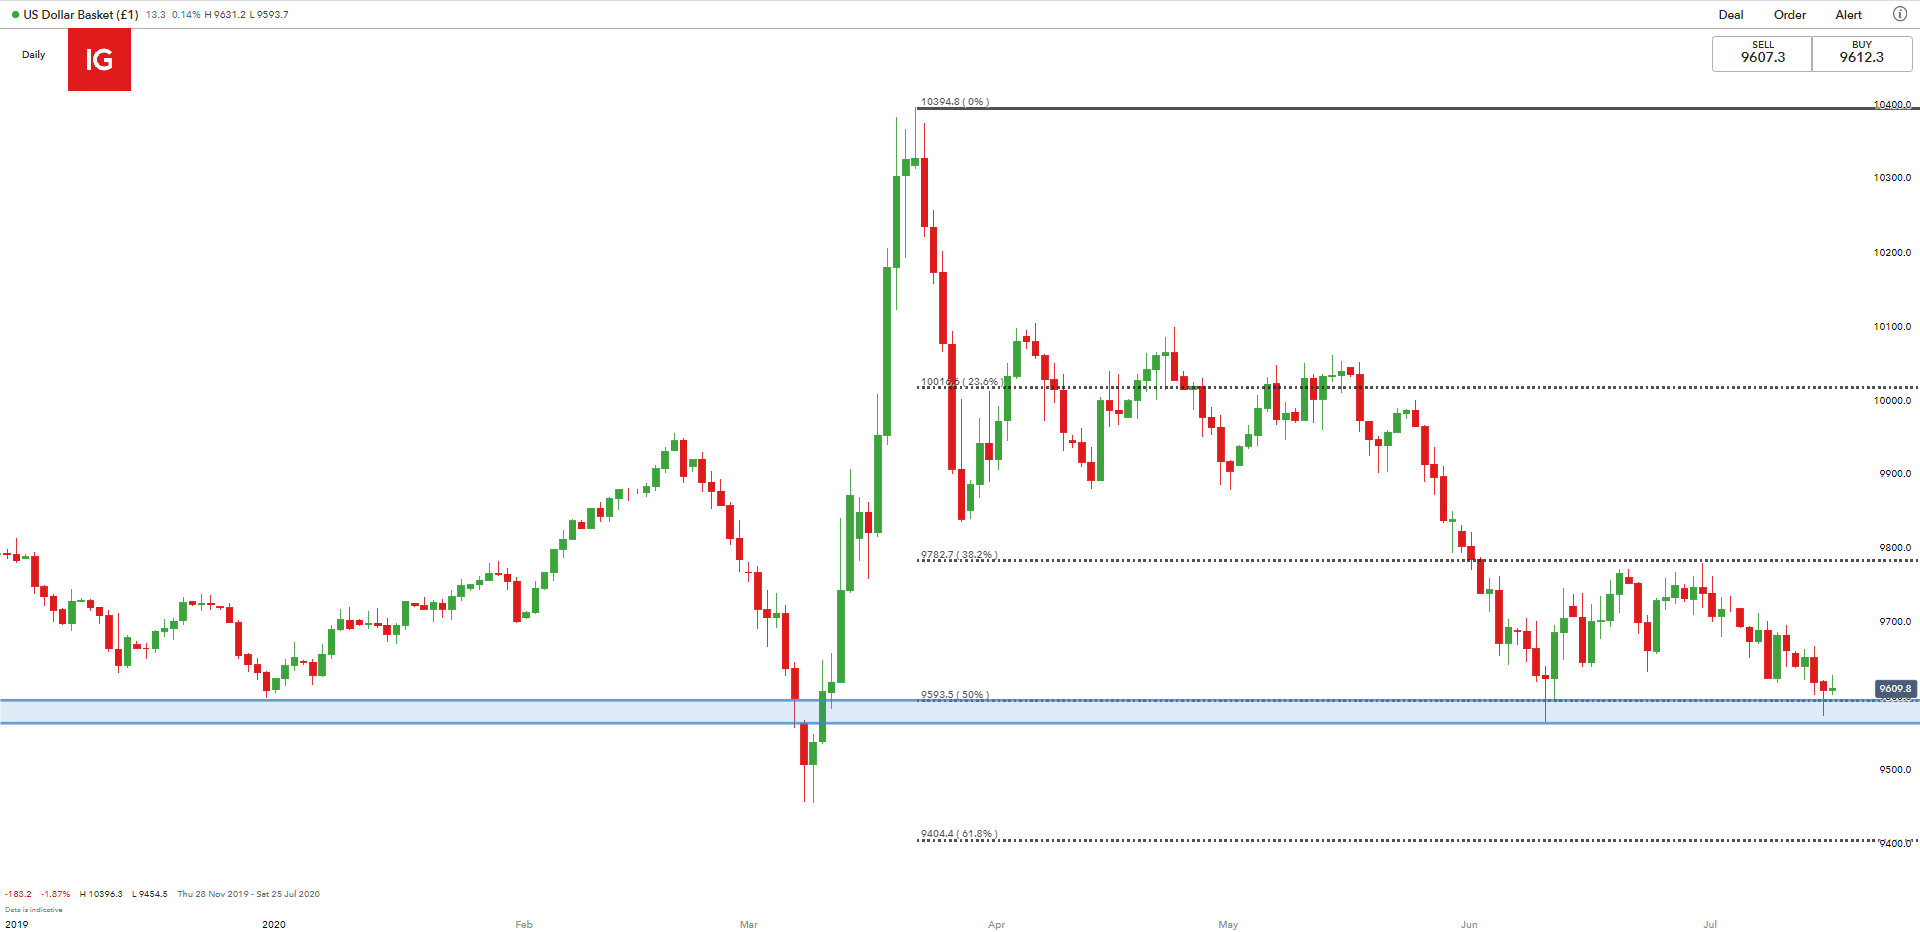
Chart prepared by Warren Venketas, IG
There are cases for both bulls and bears which will likely be resolved in Q3. Key trading points to consider:
- 1900.0 psychological level of support
- Technical indicators – RSI and MACD
- Silver volatility
- COT report and IGCS data
- US Dollar
IG CLIENT SENTIMENT DATA POINTS TO TREND REVERSAL IN FAVOUR OF BEARS
| Change in | Longs | Shorts | OI |
| Daily | 4% | -4% | 3% |
| Weekly | 11% | 13% | 11% |
In validation of the COT report (above) IGCS shows retail traders are currently prominently long on Silver, with 87% of traders currently holding short positions (as of this writing). At DailyFX we typically take a contrarian view to crowd sentiment, and the fact traders are net-long is suggestive of a reversal to the downside.

— Written by Warren Venketas for DailyFX.com
Contact and follow Warren on Twitter: @WVenketas
|
|
Leave a Reply
You must be logged in to post a comment.