

GOLD OUTLOOK & ANALYSIS
- US debt ceiling back in focus this week!
- Fed Bullard’s ultra-aggressive guidance hurts bullion.
- Technical analysis reflective of investor hesitancy.
Recommended by Warren Venketas
Get Your Free Gold Forecast
XAU/USD FUNDAMENTAL FORECAST
Gold prices are relatively stagnant this Monday ahead of the US trading session as US debt ceiling talks dominate headlines. Unfortunately, the positivity around a possible deal by today have fallen away leaving sometime towards the end of the week as a best case scenario. That being said, US Treasury yields have pushed higher weighing on the yellow metal as the opportunity cost of holding bullion rises – minimal rise in real yields. All eyes will be on President Joe Biden and Kevin McCarthy this week as discussions unfold.
A major development that has largely flown under the radar has been the dovish slant to Fed Chair Jerome Powell’s commentary last week that the Fed may be looking to pause its hiking cycle. The Fed’s Bullard has already moved against this narrative and stay firm on an aggressive monetary policy outlook expecting two additional rate hikes this year. It will be interesting to see how the upcoming Fed officials react.
Trade Smarter – Sign up for the DailyFX Newsletter
Receive timely and compelling market commentary from the DailyFX team
Subscribe to Newsletter
ECONOMIC CALENDAR
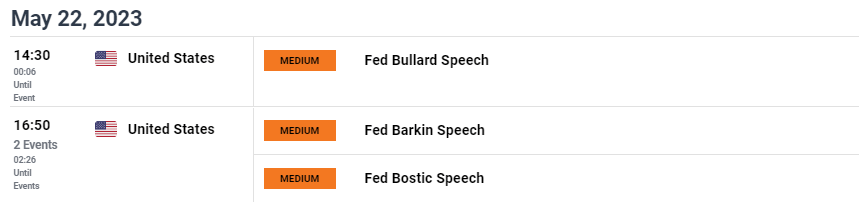
Source: DailyFX Economic Calendar
Implied Fed funds futures (below) have shifted in favor of lesser cumulative rate cuts compared to last week which has weighed negatively on gold prices – Bullard reaction.
FEDERAL RESERVE INTEREST RATE PROBABILITIES
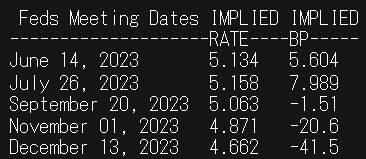
Source: Refinitiv
Foundational Trading Knowledge
Macro Fundamentals
Recommended by Warren Venketas
TECHNICAL ANALYSIS
GOLD PRICE DAILY CHART
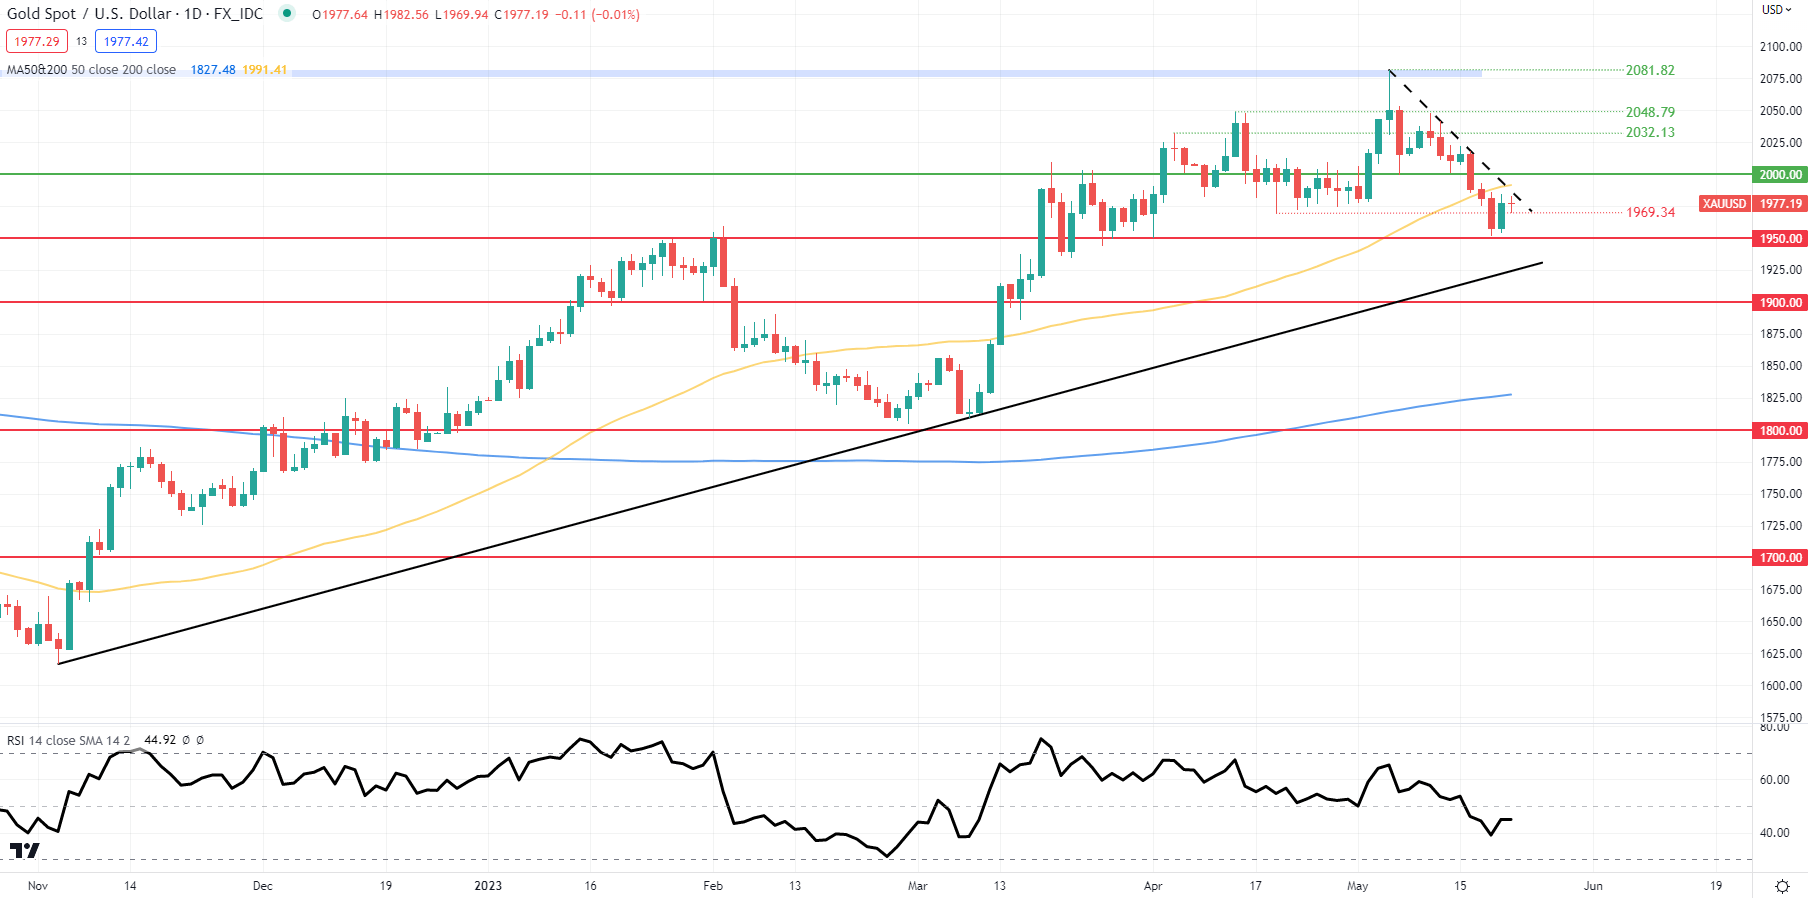
Chart prepared by Warren Venketas, IG
Daily XAU/USD price action has found support at 1950.00 psychological handle but as fundamental factors remain in a state of flux, the Relative Strength Index (RSI) reflects this ambiguity trading around the 50 level. A daily close above trendline resistance could align with debt ceiling positivity allowing the dovish Fed rhetoric to filter through and support gold prices.
Resistance levels:
- 2000.00
- 50-day MA (yellow)
- Trendline resistance
Support levels:
- 1969.34
- 1950.00
IG CLIENT SENTIMENT: MIXED
IGCS shows retail traders are currently distinctly LONG on gold, with 65% of traders currently holding long positions (as of this writing). At DailyFX we typically take a contrarian view to crowd sentiment but due to recent changes in long and short positioning, we arrive at a short-term cautious bias.
Contact and followWarrenon Twitter:@WVenketas
|
|
Leave a Reply
You must be logged in to post a comment.