

Introduction
The very high distribution yield of Crestwood Equity Partners (CEQP) is certainly alluring to many income investors, as a yield of 21% is certainly eye-catching. Whilst they have not taken the same path as many of their peers by reducing their distributions already in the first half of 2020, this could still go either way when their results for the second quarter of 2020 are released in the coming weeks.
Executive Summary and Ratings
Since many readers are likely short on time, the table below provides a very brief executive summary and ratings for the primary criteria that were assessed. The following sections all provide further detailed analysis for those readers who are wishing to dig deeper into their situation.
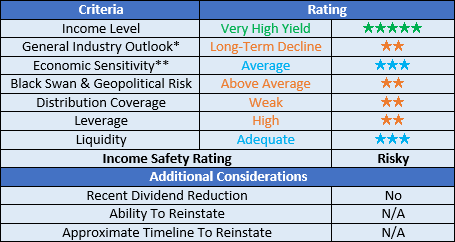
Image Source: Author.
*There are significant short and medium-term uncertainties for the broader oil and gas industry. However, in the long term, they will certainly face a decline as the world moves away from fossil fuels.
**Whilst the oil and gas industry to which they service has high economic sensitivity, given the more stable nature of the midstream sub-industry this was deemed to be average.
Ratings Summaries and System
Recently I have taken actions to make my analysis more comparable between different companies and partnerships by introducing a more standardized rating system. A list of all my equivalent ratings as well as more information regarding my rating system can be found in the following Google Document. Whilst the list is only small at the moment, please check back across time since it will continue growing in tandem as my coverage continues growing.
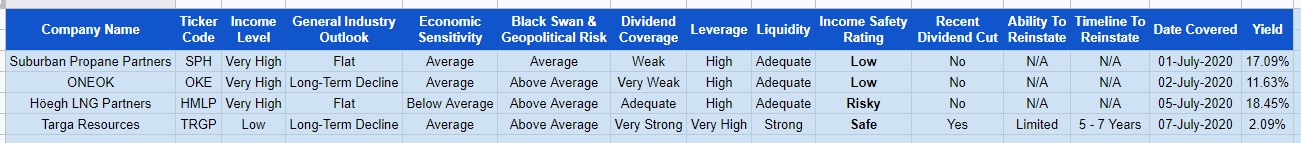
Image Source: Author.
Detailed Analysis
![]() Image Source: Author.
Image Source: Author.
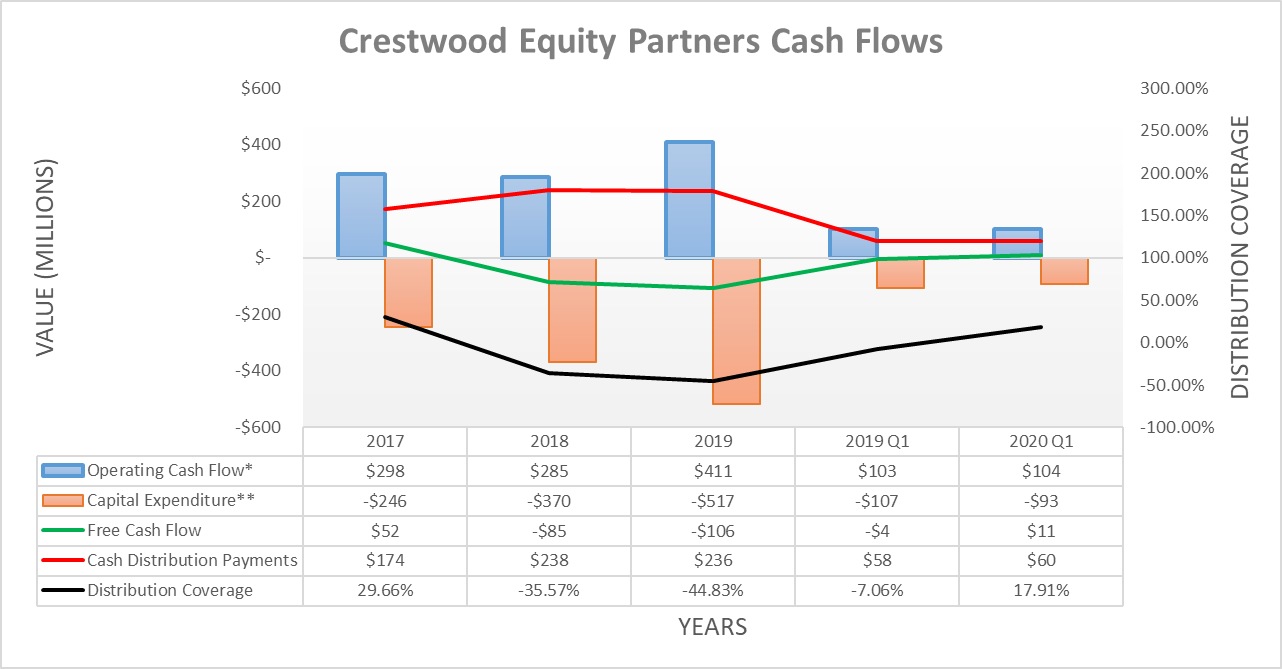
Instead of simply assessing distribution coverage through distributable cash flow, I prefer to utilize free cash flow since it provides the toughest criteria and best captures the true impact to their financial position. The main difference between the two is that the former ignores the capital expenditure that relates to growth projects, which given the very high capital intensity of their industry can create a material difference.
It should be mentioned that their distributions to both common and preferred unitholders are grouped together, here on referred to as total distributions. Even though this analysis focuses on the sustainability of their distributions to common unitholders, this does not hinder the analysis since preferred distributions outrank common distributions. This means that if they cannot afford to sustain both together, then naturally their common distributions could see sizeable reductions.
When reviewing their previous cash flow performance from 2017-2019, it can be seen that their distribution coverage has always been very weak, evidenced by the high point of their coverage being only 29.66%. This indicates that their distributions have normally been funded through debt and whilst this sets a negative precedence, their prospects going forward are more important.
After annualizing their total distributions during the first quarter of 2020, it indicates that these will cost them $241m per annum. Their guidance for growth and maintenance capital expenditure for 2020 is $150m and $13m at the midpoints, respectively, as per slide nine of their first quarter of 2020 results presentation. This indicates that they require operating cash flow of $404m to remain cash-flow neutral and thus provide a bare minimal level of adequate distribution coverage.
Based on their recent performance and guidance, this will still be a tricky feat despite their massive capital expenditure reductions. There are two ways to view their scope to accomplish this feat, with the first being to annualize their operating cash flow from the first quarter of 2020 excluding working capital movements. This produces a result of $400m, which is essentially equal to their estimated cash outflows of $404m and thus means that their distribution coverage would be at the crux between adequate and weak. The second way is to assume that their operating cash flow will see the same increase as their adjusted EBITDA, which their guidance for 2020 indicates will see an increase of 3.51% at the midpoint. This produces a result of $425m, which is slightly above their estimated cash outflows and thus means that their distribution coverage would just be enough to be considered adequate.
Whilst these results indicate that their distribution coverage for 2020 could be adequate, it provides no margin of safety since it barely sits above 100%, which is right at the bottom of the range for adequate coverage. Even though this would still normally be sufficient to rate their distribution coverage adequate, their coverage was nonetheless deemed to be weak since it also results from massive capital expenditure reductions of 68.47% compared to 2019. To consider their distribution coverage adequate with such a small margin of safety, I would have wished to see it as a result of growing operating cash flow and not massive capital expenditure reductions since these will hurt the long-term growth of the company and could possibly be reversed in the future.
It should also be noted that their maintenance capital expenditure is seeing a 44% reduction, which is quite significant considering that this expenditure is supposedly required to keep their assets operating. Hopefully, these reductions do not result in deteriorated asset quality nor heightened safety risks in the medium to long term.
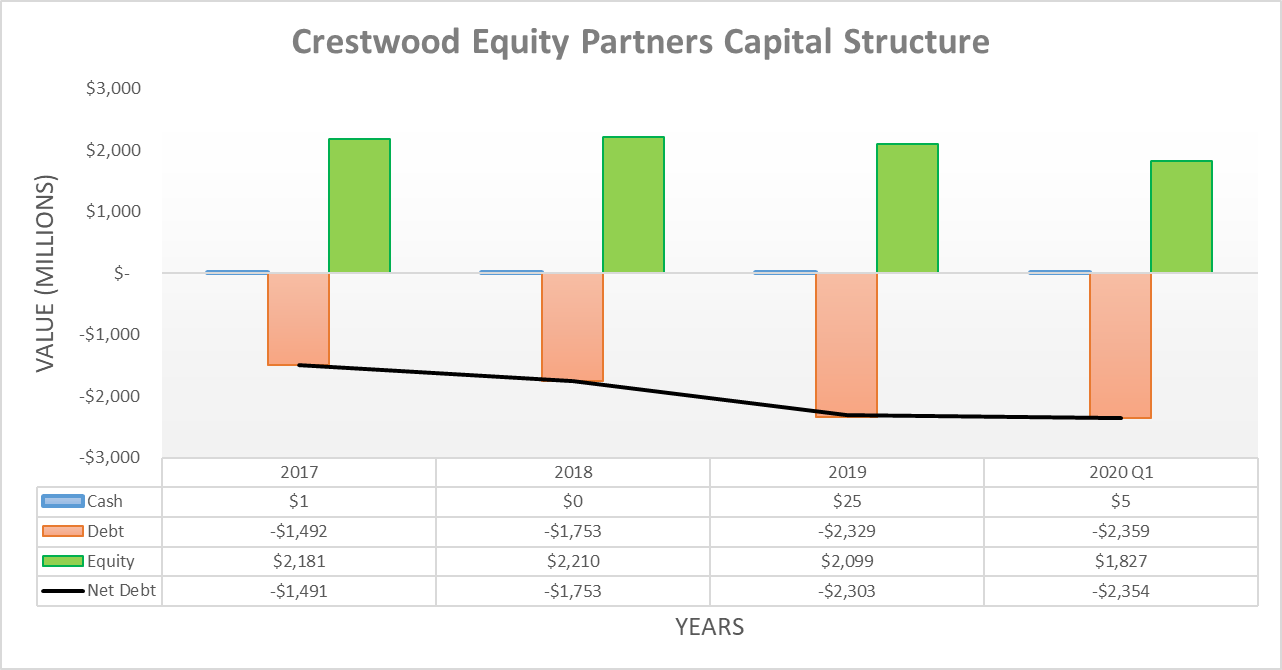
Image Source: Author.
The primary cause behind their higher net debt at the end of 2019 versus 2018 was due to their Jackalope Gas Gathering Services $462m acquisition. When this is combined with the thin margin of safety that their distribution coverage provides, it means that their leverage will be of especially high importance.
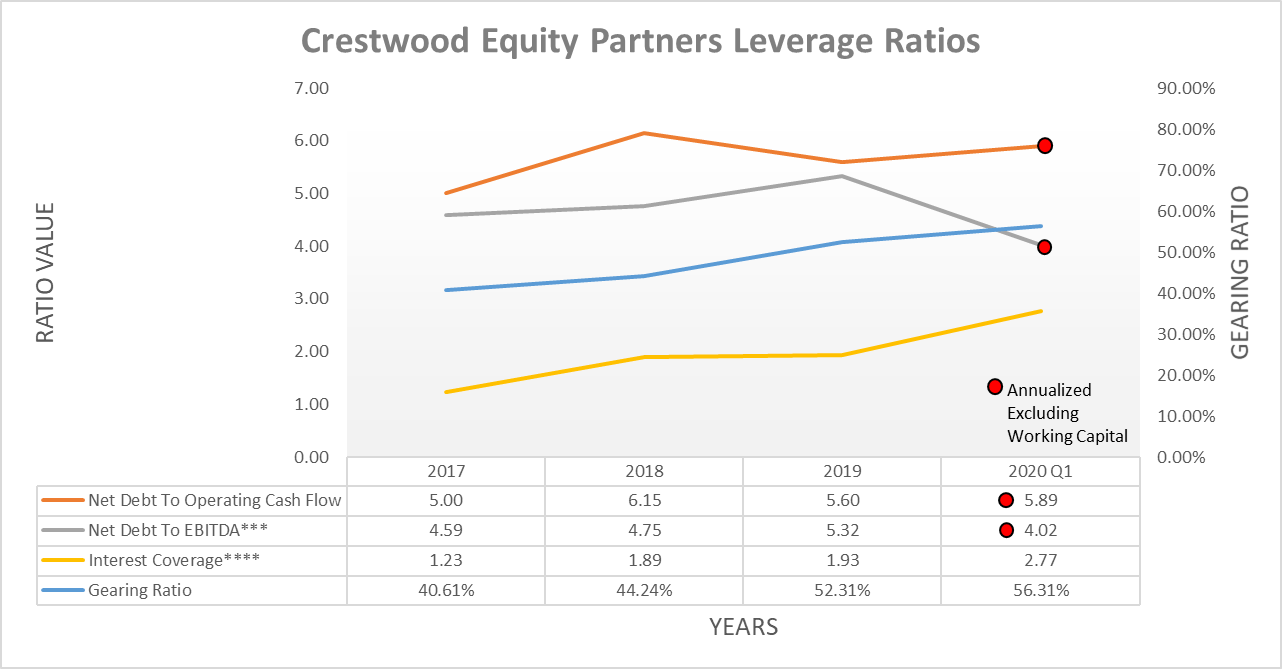

Image Source: Author.
Similar to their distribution coverage that is stuck at the crux between weak and adequate, unfortunately it appears that their leverage is also stuck between high and very high. Their net debt-to-EBITDA of 4.02 and interest coverage of 2.77 improved significantly during the first quarter of 2020; however, this was not reflected by their net debt-to-operating cash flow excluding working capital movements. The maximum level for their net debt-to-EBITDA for their leverage to be considered only moderate would be under 3.50, with anything above 5.00 being considered very high.
Ultimately, their leverage was deemed to be high and whilst this is less than ideal, thankfully it does not necessarily pose a threat to their ability to remain a going concern, depending on the state of their liquidity. Although it further highlights their thin margin of safety for sustaining their distributions and thus how it could go either way when they release their results for the second quarter of 2020.
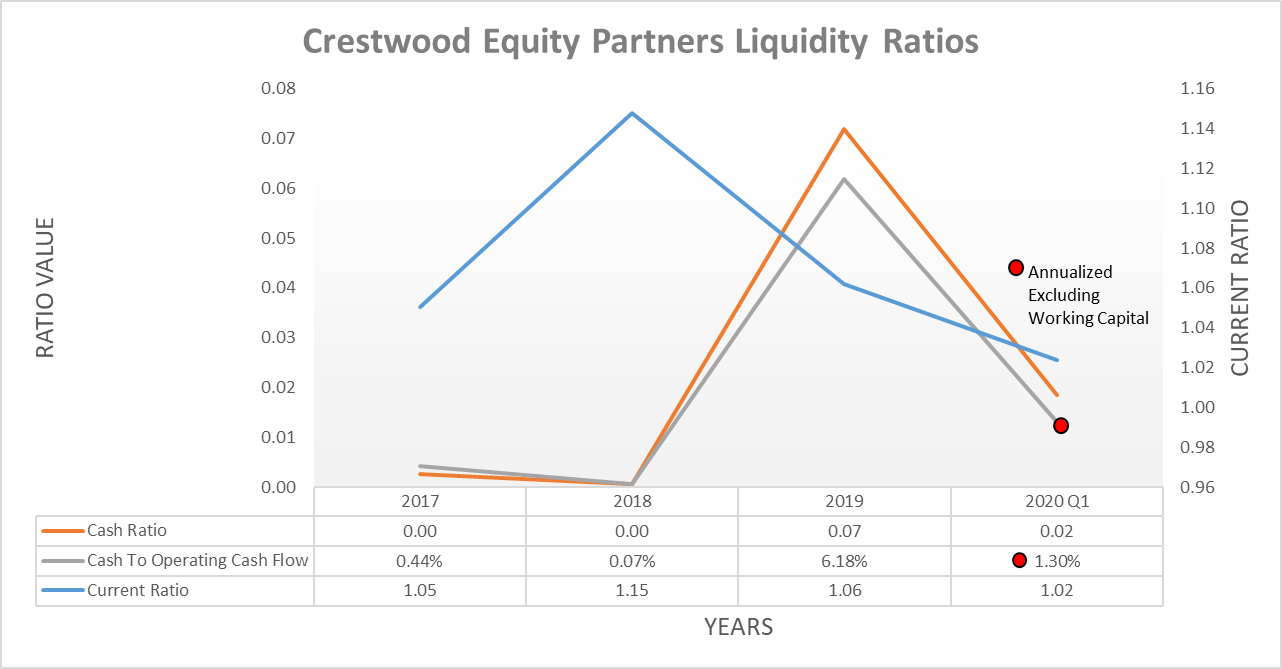
Image Source: Author.
Thankfully, their liquidity is adequate and thus their high leverage does not pose an immediate threat to their ability to remain a going concern. Whilst their current ratio of 1.02 is quite decent, unfortunately their virtually non-existent cash balance leaves them reliant on their credit facility. It still retains $636m undrawn and available; however, drawing upon this simply to pay distributions would be quite dangerous and push them towards the limits imposed by their covenants.
Since they do not face any debt maturities until April 2023 they have a degree of room to arrange repayment or refinancing, as the table included below displays. Whilst this supports their ability to remain a going concern, it does not alleviate the pressure on their distributions brought about by their thin margin of safety.
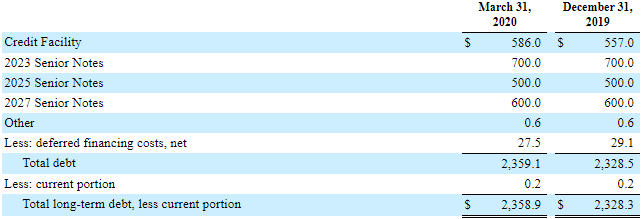
Image Source: Crestwood Equity Partners’ Q1 2020 10-Q.
Conclusion
There are reasons to believe that their distribution will be reduced when they release their results for the second quarter of 2020, largely due to their thin margin of safety from their coverage and high leverage. Although following their massive capital expenditure reductions a case can still be made that they will continue pushing through and thus try to stand out from the crowd by keeping their distributions steady.
It may sound rather abnormal but I believe that a bullish rating is still appropriate despite the risk that they reduce their distribution. It seems that at minimum they can fundamentally afford half their current distribution, which would still provide investors with a very high yield slightly over 10%, which is hard to beat since it would then offer the all-important margin of safety.
Notes: Unless specified otherwise, all figures in this article were taken from Crestwood Partners’ Q1 2020 10-Q (previously linked), 2019 10-K and 2017 10-K SEC Filings, all calculated figures were performed by the author.
Disclosure: I/we have no positions in any stocks mentioned, and no plans to initiate any positions within the next 72 hours. I wrote this article myself, and it expresses my own opinions. I am not receiving compensation for it (other than from Seeking Alpha). I have no business relationship with any company whose stock is mentioned in this article.
|
|
Leave a Reply
You must be logged in to post a comment.